
Profit Per Hour: Why Your Biggest Cleaning Job Might Be Your Worst One
Ask most cleaning business owners which job was their best last month and they will name the biggest invoice. It is the natural answer. It is also, often, exactly wrong.
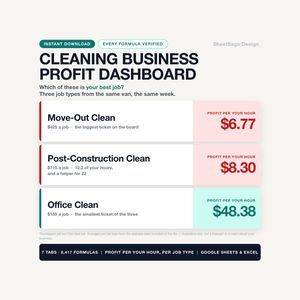
Here are three jobs from the same week, straight out of the worked example data in our cleaning dashboard:
| Job | It bills | It pays, per hour of your time |
|---|---|---|
| Move-out clean | $425 | $6.77 |
| Post-construction | $715 | $8.30 |
| Office clean | $185 | $48.38 |
(Example data included with the workbook. Your numbers will be different — the point is the shape, not the figures.)
Same van, same week, same owner. The $185 job pays more than seven times what the $425 job pays for an hour of your life. And there is no column in any revenue tracker that would ever have told you that.
Why revenue lies
Revenue is the number everyone looks at because it is the number that is easy to know. It arrives in your bank account, it appears on the invoice, it feels like the score.
But revenue only measures what came in. It is silent about three things that come straight back out — and those three things are not spread evenly across job types. That is the whole problem. If every job leaked money at the same rate, revenue would rank your jobs correctly and you could stop reading. They do not.
The helper's real cost. A helper you pay $20 an hour does not cost you $20 an hour. Once you add payroll burden — the employer-side taxes and costs that ride on top of the wage — that same hour might cost you $22.40. Twelve percent sounds like a rounding error until it lands on an eleven-hour crew job, and the jobs that need a crew are precisely the big-ticket ones. This is the single most common reason a job that looked profitable at the quote stage is not profitable at the end.
Supplies. Small on a standard clean, not small on a post-construction job. Charged as a flat allowance in your head, variable in reality.
Drive time. The one that gets ignored completely, and the one that changes the ranking most.
Drive time is your time
Here is the decision that makes profit-per-hour honest, and it is worth being blunt about it: drive time goes in the denominator.
If a job takes you four hours on site and one hour round trip, that job consumed five hours of your working life. You cannot do anything else with that hour. You cannot sell it to anyone. It came out of the same finite pile of hours that the on-site work came from.
And on hourly-priced work, you are almost certainly not billing it to the client. So it is unpaid time that reduces what the job earned per hour — full stop.
Count it and something uncomfortable happens: the numbers in your spreadsheet stop matching the numbers in your head. That is not a bug. The numbers in your head were leaving out a real cost, which is why the month kept ending with less than it should have.
It also immediately explains a pattern most owners have noticed but never quantified — that the job across town at the good rate somehow never feels as good as it should.
The formula
There is only one:
Profit per hour  =  ( Revenue − helper cost with burden − supplies − mileage )
                    ÷ ( your on-site hours + your drive time )
That is it. Everything else is bookkeeping around this one line.
Run it on every job for one month and you stop guessing about your business. Run it on job types and you get something more useful still.
The table that settles arguments
Once you have a few dozen jobs logged, group them by type and rank by profit per hour. From the same example data:
| Job type | Profit / hour |
|---|---|
| Office clean | $48.38 |
| Standard clean | $47.05 |
| Airbnb turnover | $44.04 |
| Deep clean | $38.24 |
| Post-construction | $8.30 |
| Move-out clean | $6.77 |
Look at what happened to the ranking. The two job types with the largest invoices sit at the bottom. The unglamorous recurring office contract sits at the top.
This table is what ends the recurring debate every cleaning business has with itself — should we chase move-outs? Are Airbnb turnovers worth the hassle? You are not arguing about it anymore. You are reading it.
And note that the answer is not automatically "stop taking move-outs." A job type at the bottom of this table has three possible futures:
- Raise the price. If a move-out clean has to bill significantly more to reach your target, now you know the actual figure to quote rather than a nervous guess.
- Re-scope it. Cut the helper hours, tighten what is included, or stop absorbing supply costs that belong to the client.
- Stop taking it. Sometimes the honest answer, and much easier to accept when it is a row in a table rather than a feeling.
What you cannot do is keep taking it while believing it is your best work because it has the biggest number on the invoice.
The target, and the gap
A profit-per-hour figure is only meaningful against a number you chose. Set a target — what an hour of your time needs to earn for the business to work — and measure against it.
In the example data, a month came in like this:
Revenue                $2,950.00
Total job costs        $1,011.58
Profit                 $1,938.42
Your hours                  53.2
─────────────────────────────────
Profit per hour           $36.47
Target                    $45.00
                     $8.53/hr short
Ten jobs that month came in under target. Closing that gap was worth $1,357.49 — a number that is invisible in a revenue column and obvious the moment you compute per-hour profit per job.
That is not a projection or a promise about anyone's business. It is arithmetic on one month of example data, and the same arithmetic runs on yours.
The second leak: the client who quietly stopped booking
While you are counting hours, there is a slower leak worth closing.
Losing a weekly client is rarely an event. Nobody fires you. They just do not appear on next month's schedule, and you are busy, and three months later you notice.
The fix is mechanical. Record how often each client is supposed to be visited — weekly, biweekly, monthly, quarterly. Then, for each one, compare the last visit against the schedule and look forward through your own job log to see whether the next visit is actually booked. If it is not, flag it with the monthly dollars beside the name:
Ridgeline Rentals OVERDUE TO REBOOK - 17 days past due $543.15 / mo
In the example data, $802.19 of monthly revenue was sitting unbooked across a handful of clients. A weekly client is not a bad week when they disappear — over a year, it is a serious number leaving without a single conversation.
The reason to build this into the same spreadsheet as the job log is that it then maintains itself. Booking the next job clears the flag, because booking the next job is the only thing that should.
Doing it without a second job
Every calculation above is straightforward. What is not straightforward is doing it by hand, per job, per week, forever, on top of actually cleaning.
Our Cleaning Business Profit Dashboard is this math already built: 300 job rows where twelve columns calculate themselves, helper costs run at wage plus your payroll burden, drive time sits in the denominator of every per-hour figure, and the dashboard ranks every job type by what it actually pays. Blank cells fall back to that job type's defaults, so logging a repeat job takes about fifteen seconds. Unpaid invoices age themselves, and the rebooking alert above runs off the job log with nothing extra to type.
Google Sheets and Excel, one file, instant download, no subscription.
If your crew works in construction rather than cleaning, the same burden arithmetic sits inside our Contractor Estimating & Job Profit System: wages loaded with your own burden percentages, margin and markup shown side by side on every estimate line, and the work you have already done but not yet invoiced. It works out a planning estimate, not a bid, and not professional advice.
Your busiest month is not always your best month. This is how you find out which one you just had.
Every dollar figure in this article comes from the example data included in the workbook. It illustrates how the math works — it is not a forecast, a benchmark, a market rate, or a claim about your business. The workbook is a tracking and planning tool, not accounting, tax, payroll or legal advice; talk to your own accountant about anything touching tax or payroll.
 Your busiest month is not always your best month. This tells you which one you just had.…
See the Cleaning Business Profit Dashboard →